
Open Source Monitoring Tools: Uptime, Status Pages, Metrics and Errors
 Niklas KarolyFounder Nodion
In short
- Open source monitoring covers four jobs: uptime checks (SolidPing), status pages (Kener), server metrics (Beszel, Komari) and error tracking (GlitchTip, Rustrak).
- All six use OSI licenses: MIT for Kener, Beszel, Komari and GlitchTip, AGPL-3.0 for SolidPing and GPL-3.0 for Rustrak.
- GlitchTip and Rustrak accept events from Sentry's client SDKs, so switching means pointing the DSN at your own instance.
- Nodion also has built-in uptime checks for any URL or app, from every 30 seconds, with alerts by email, Slack, Discord and more.
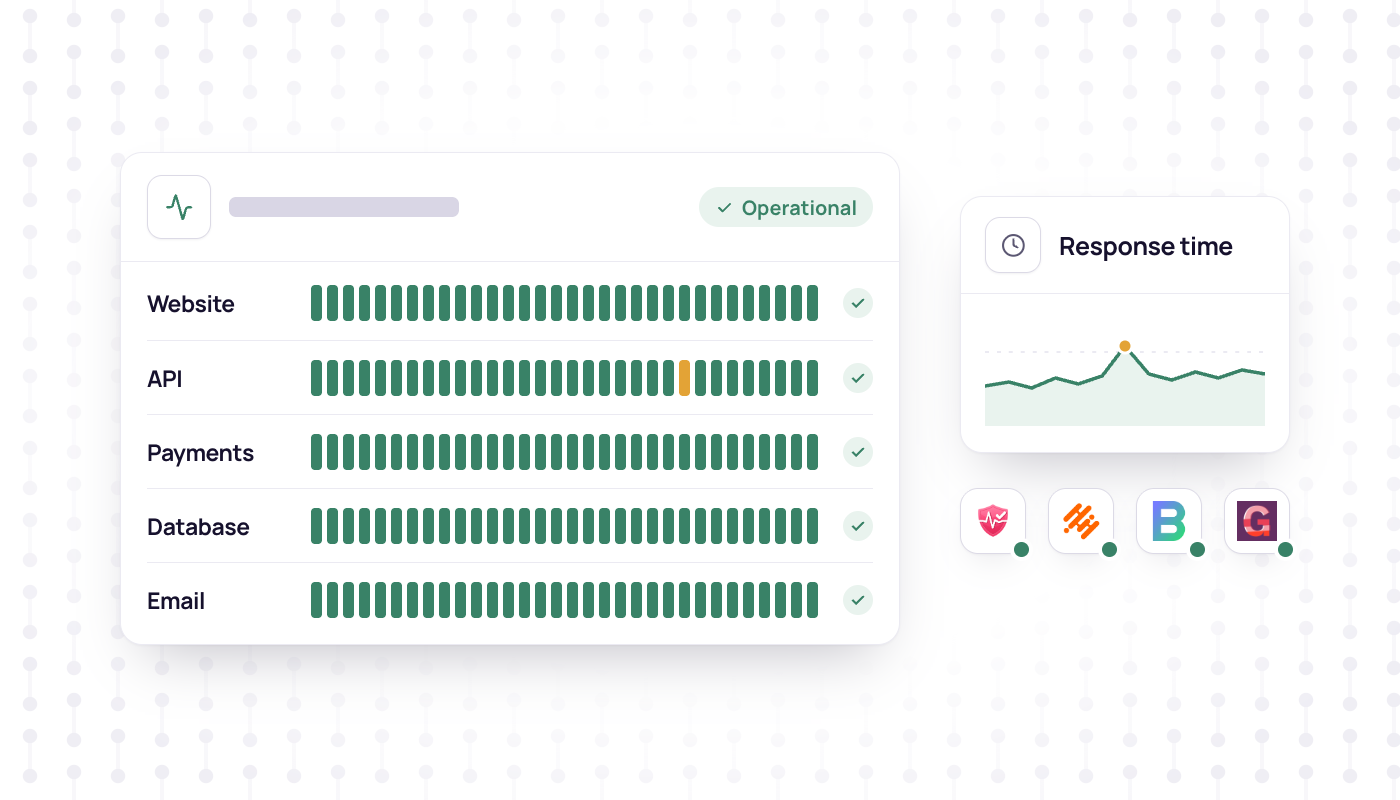
"Monitoring" is four different jobs: checking that your site answers, telling users what is going on with a status page, watching the servers underneath, and catching the errors your code throws. Open source tools exist for each job, and the six below run as your own instance from the Nodion one-click catalog.
One rule applies to all of them: run the monitor somewhere other than what it watches, for example in another region. Otherwise one outage takes down both the app and the tool that should report it.
At a glance
| Tool | Job | License | Runs with |
|---|---|---|---|
| SolidPing | Uptime checks, status pages, on-call | AGPL-3.0 | PostgreSQL, object storage |
| Kener | Status pages and incidents | MIT | PostgreSQL, Valkey |
| Beszel | Server and container metrics | MIT | Volume |
| Komari | Lightweight server metrics | MIT | Volume (SQLite) |
| GlitchTip | Error tracking, plus simple uptime checks | MIT | PostgreSQL, volume, email zone |
| Rustrak | Error tracking in one small process | GPL-3.0 | PostgreSQL, volume |
How we picked
- Does one of the four jobs well: uptime checks, status pages, server metrics or error tracking.
- Runs as your own instance from a container image.
- OSI open source license, checked against each project's LICENSE file.
- Small footprint: the presets need at most 1 GB of memory.
1. SolidPing: uptime checks
SolidPing is a full uptime monitor in a single Go binary. Its checks go well beyond HTTP: TCP, UDP, ICMP, DNS, SSL certificates and domains, mail servers, gRPC, databases, message queues and more. Checks can run from workers in several regions, and private agents check targets inside your own network over an outbound WebSocket (see the README). On top come status pages, incidents that send one alert per outage instead of one per check, maintenance windows, on-call rotations with escalation, and notifications to Slack, Discord, email, webhooks, PagerDuty, ntfy and others.
License: AGPL-3.0. License file, project site.
On Nodion: one web process with PostgreSQL and an object storage bucket. Sign in with admin@solidping.io and solidpass; SolidPing makes you set a new password on the first login. Do that right after the first deploy, before you share the URL: these defaults are public, so whoever logs in first claims the instance.
2. Kener: status pages
Kener focuses on the page your users see. It builds branded status pages with your logo, colors and CSS, light and dark mode, and status widgets and badges you can embed elsewhere. Incidents get a timeline with updates, and maintenance windows are announced ahead of time. Kener runs its own checks too (API, ping, TCP, DNS, SSL, SQL and heartbeat), notifies by email, webhook, Slack or Discord, and one instance can serve several status pages.
License: MIT. License file, project site.
On Nodion: one web process with PostgreSQL and Valkey, with the app's URL already set as Kener's origin. On first open, Kener shows a setup form for the owner's name, email and password.
3. Beszel: server metrics
Beszel watches machines rather than URLs. A small agent on each server reports CPU, memory, disk usage and I/O, network, temperatures, GPU usage and Docker or Podman container stats to the hub, which keeps the history and sends alerts. It supports multiple users, OAuth and OIDC sign-in, and automatic backups to disk or S3-compatible storage.
License: MIT. License file, project site.
On Nodion: the preset runs the hub as one web process with a 10 GB volume. Agents are not part of the deploy: install them on the machines you want to watch, and they can connect out to the hub over WebSocket. The first visit asks you to create the admin account.
4. Komari: lightweight server metrics
Komari is an even smaller server monitor. Agents report CPU, memory, disk, network and uptime, and the dashboard shows live data at one-second intervals plus history charts. Themes and plugins change the look. The admin area also includes a web terminal for connected servers, so protect the admin login as you would a root password.
License: MIT. License file, project site.
On Nodion: one web process with SQLite on a 10 GB volume. Sign in as admin with the generated ADMIN_PASSWORD from the Environment tab. Agents connect back over HTTPS to the app's URL, so no extra inbound port is needed.
5. GlitchTip: error tracking
GlitchTip is an error tracker that works with Sentry's client SDKs: point the DSN of the SDK you already use at your instance, and exceptions, log messages and Content Security Policy violations arrive in one place. It also lists your slowest requests and database calls, and has simple uptime monitoring: it pings your site, or waits for a heartbeat from a scheduled job, and alerts by email or webhook.
License: MIT. License file, project site.
On Nodion: one web process with PostgreSQL, a 10 GB volume for uploads and an email zone for outgoing mail. On first open, you register the first user.
6. Rustrak: error tracking
Rustrak also speaks the Sentry protocol, so an existing Sentry SDK only needs a new DSN. It runs as one small process and accepts events by writing them to disk first, so a traffic spike does not wait on the database. Besides errors it takes logs, transactions, release health and traces from AI agents.
License: GPL-3.0. License file, project site.
On Nodion: one web process with PostgreSQL and a 10 GB volume. Sign in with the email admin and the password after the colon in CREATE_SUPERUSER on the Environment tab.
Monitoring built into Nodion
If your apps run on Nodion, the basic uptime check is already there. Monitoring in the dashboard (the product calls them observers) watches any http(s) URL or one of your apps and its domain, every 30 seconds up to every 30 minutes, with GET or HEAD. You set the status code you expect, and anything else counts as down. Alerts go to email, Slack, Discord, Google Chat, Telegram, Pushover, ntfy or any webhook, and every check is stored with its response time and region. If Nodion's probe fails instead of your site, the check is marked and does not count as downtime. Setup is in the monitoring docs.
For a public status page, server metrics or error tracking, add one of the tools above.
Also worth a look
- Tianji (Apache 2.0) combines website analytics, uptime checks and status pages in one app, and it is in the one-click catalog too.
- Uptime Kuma (MIT) is a simple uptime monitor with HTTP, TCP, ping and DNS checks, many notification services and multiple status pages.
How to choose
- You want many check types, status pages and on-call in one tool: SolidPing.
- You mainly need a polished public status page with incidents: Kener.
- You want CPU, memory, disk and container metrics from your servers: Beszel, or Komari for an even lighter setup.
- You want to catch errors from your code with the Sentry SDKs: GlitchTip, or Rustrak for a single small process.
- Your apps already run on Nodion and you need uptime alerts: the built-in Monitoring.
Each tool runs on Nodion as your own instance in the region you pick, EU Central (Frankfurt), US East or US West. Browse all apps in the one-click catalog.
Frequently asked questions
What is the best open source uptime monitoring tool?
SolidPing if you want many check types, checks from several regions, status pages and on-call in one tool. Uptime Kuma (MIT) is a simpler option with HTTP, TCP, ping and DNS checks and status pages.
What is a good open source status page?
Kener (MIT) builds branded public status pages with incidents, maintenance windows and embeddable badges, and runs its own checks. SolidPing also includes status pages.
Is there an open source alternative to Sentry?
Yes. GlitchTip (MIT) and Rustrak (GPL-3.0) both accept events from Sentry's client SDKs, so you switch by pointing the DSN at your own instance.
Does Nodion have uptime monitoring?
Yes. Monitoring in the dashboard checks any http(s) URL or one of your apps every 30 seconds up to every 30 minutes, and alerts by email, Slack, Discord, Google Chat, Telegram, Pushover, ntfy or webhook.